The current Symptom/sign archetype was first published in October 2015 following a seven month review process.
Since then the archetype has had several breaking changes applied, and has been sitting in the ‘Reassess’ state since April 2018.
The COVID-19 related work of early 2020 led to the creation of the new ‘screening questionnaire’ family of archetypes, of which Symptom/sign screening questionnaire is one of the most central members. The creation of this archetype also means we can rectify one of the most awkward modelling choices of the original Symptom/sign archetype; the ‘Nil significant’ element. This was intended to support structured questioning where the subject could respond whether they experienced a symptom or not. In effect it was a kind of negation element in an otherwise positive presence archetype, which leads to potential safety issues when querying the data. In the latest revision of the ‘Symptom/sign’ archetype the ‘Nil significant’ element has been removed, to be replaced by the ‘Symptom/sign screening questionnaire’ archetype where appropriate.
Other significant changes include:
Revision of the ‘Occurrence’ element (breaking change)
Separation of the ‘Precipitating/Resolving factor’ cluster into two separate clusters, removing the need for the run-time name constraint (breaking change).
Addition of the ‘Character’ element (non-breaking change)
Various non-breaking updates and corrections
Corrections to SNOMED CT bindings
We’d like to publish the current trunk revision as v2 of the archetype, but would like community input first, to make sure we catch any errors or other suggestions that would need breaking changes.
‘Nil significant’ was always a bit tricky and the new screening questionnaire is better suited for that ‘closed questioning’ type of situation.
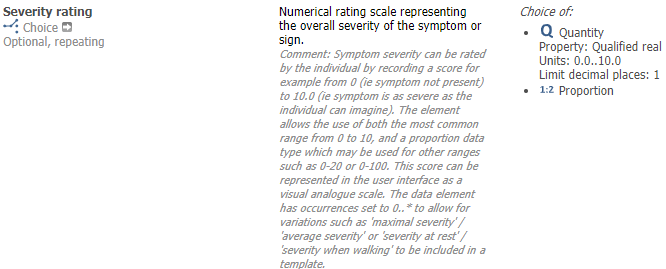
The only other change to Symptom (I have just submitted a CR) is to widen the Severity rating limit to 0.100 from 0…10 as we have come across a few places where 0 to 100 is the range used.
Which means values in data will not be computably comparable, e.g. graphing over time of severity of symptoms of chronic arthritis would no longer work (well, it might work by accident, but it would not be reliable). If it had to be unconstrained I’d say you should require a numerator and a denominator, i.e. a ratio. Then you can compare severities across Observations…
In theory that should be possible (though probably not as useful as you might think) but it requires everyone to be working of the same hymn sheet and like it or not there are a million different approaches to recording 'severity/ The best we can do is mandate ate national/ regional/ condition-specific contexts where we can get clinical agreement.
The use of proportion might be worth considering but will be counter-intuitive to a lot of clinical folks - I can see the value but but I do know of one score which allows for >100%.
That would work technically but It would need quite a good explanation of how to use proportion, let’s say to model a score from 0 to 153, just to be awkward! That could be done in description and comment, of course.
Support strongly that values in an individual are reliably computable: time-serialisation is central to practice.
I have researched 20 commonly-used scoring systems, and would observe:
those that are indexes are expressed as %, so values never exceed 100.
of the others, max value range is 27, for PHQ9, except for the Minnesota Multiphasic Personality Inventory 2 with a max score of 567!
Resolution is another matter: can a MH measure really be valid to 3 decimal places? Such high-resolution data is very rare in clinical practice IMO.
So suggest that nearly all use cases can be quantified as up to 100, and edge cases such as MMPI could be converted to % of max value limited to 2 decimal places?
Or is there another way to directly model those few scales that use higher-resolution data?
So for generic “severity” there are currently are 3 semantically-progressive texts that align with SCT codes, and also refer externally to “activity.” That is low resolution.
Likert scales are most often 5-point, ranging from 2 to 10 - so resolution is to 1 decimal. The downside of hi resolution is to magnify inter-user variation, whereas lo resolution forces choices that may be wrong.
% is suggested, and @ian.mcnicoll wrote “we have come across a few places where 0 to 100 is the range used.” Did these use this generic archetype but ideally would have a separate OBSERVATION archetype?
As others have suggested SCT has 2 further terms, for Trivial 162466003 , and for Very Severe 162471005.
So adding these would give a 5-point text scale at 1-decimal resolution.
As these extend the current range, data already recorded would be compatible?
Suggest to define Trivial as “The intensity … is not present during normal activity”
For Very Severe “The intensity … prevents any activity”
(In Severe, the def seems to have a typo: “The intensity … causes prevents normal activity.” but “causes” is redundant)
Can you share those examples? I’m curious to understand the requirement better.
If we are recording the result of asking a patient to describe the severity of a symptom they are experiencing, I don’t understand how they can differentiate between 70 and 71 out of 100 with any precision.
The score is a general measurement of pain experience, not a description of specific, localized pain.
Depending on the measuring method used, it indicates the level of pain experienced by the patient on a scale of 0 to 10: 0 = no pain and 10 = the worst pain imaginable. No descriptions are used for the intermediate values, so that the value is displayed as a number and not as a code.
Sometimes a value range of 0-100 is used instead of 0-10."
and digging a little further
For what it’s worth I share your clinical view that 71 vs 72 is pretty meaningless, nevertheless 0…100 does seem to be fairly established. Tom’s suggestion of using Proportion initially seemed counter-intuitive but I can see how it does solve the problem, though I would question whether comparing different VAS scores with different ranges is going to be a real-world requirement. A lot will depend on the content of the question, not just the response.
The archetype has constraints of 0-10 to support the Numerical Pain Rating Scale (NPRS) exactly as described in the BPS document.
The range of 0-100 requirements seem to come into play with the VAS - measuring a mark made by the patient somewhere along a 10 cm scale. Interestingly it’s not described as a 100mm scale.
From memory, we did discuss this at the time of archetype review and publication but decided that it was measuring the same thing but in a slightly different way. In response, we changed the data type from a DV_COUNT (which is all the NPRS requires) to DV_QUANTITY (using a Qualified real property allowing a single decimal point) so that a point that was recorded at 7.1 cm along the 10cm scale could be recorded as ‘7.1’ rather than ‘71’. In this way, both rating scales could utilise the same data element.
We clearly haven’t captured this adequately in the archetype to explain that logic. Rather than changing anything is it possible to cater for the ZIBS/VAS requirement in this way? It makes more sense to me to record the actual ‘7.1’ rather than recording ‘71’. The level of accuracy of where a patient makes that mark on the 10cm scale will never be significant to the millimetre but the clinical intent is really to achieve the same outcome.
My less favoured alternative would be to extend the existing data element constraints to 100.
I don’t see any reason to go down the Proportion path.
While I doubt that we would ever query this directly, there may be situations where we want to graph pain levels eg an NPRS scale in a patient app followed by a VAS while in hospital. Keeping constraints at 0-10 means we could graph these measurements without transformation.
My 10c worth…
BTW
It might be worth letting the ZIBS people know that the link references a specialised archetype for pain that no longer exists
This data element is intended to carry the patient’s estimate of the severity for a single symptom, usually as part of ad hoc history-taking in a consultation or perhaps the context of a screening questionnaire for any symptoms.
I agree that many of the thousands of indexes and scores have different ways of doing things related to recording symptom severity including text categories and specific timeframes or contexts eg ‘rate the severity of x during the past 3 nights’. We have example archetypes faithfully representing the exact content of many scores and scales as standalone OBSERVATIONs. I’d suggest that the MMPI should be best represented as it’s own archetype or family of archetypes that carefully represents all of the questionnaire, including the validated value options, rather than trying to reuse this CLUSTER for that purpose.
The challenge is zibs are data exchange models. So every implementer would have to support processing a received zib to fit the archetype. So every implementer would have to build the logic to transform 71 to 7,1. Currently with 2-3 vendors that’s manageable. But I’m not sure it’s desirable from a safety perspective. Especially since the zib is usually already transformed by another vendor with a (non openehr) datamodel.
Unifying for graphing is interesting but also has its risks. The data is probably not comparable enough to present as first order data with the care organisations own data.
A lot of their ckm references are way outdated. I’m sad to think they lost interest in openEHR some time ago. (And even sadder they don’t just use the openEHR stuff)