Hi!
One of the laboratories at Karolinska University Hospital is exploring ways to include capillary electrophoresis curves as further details of the laboratory (analyte) result stored in an openEHR CDR in order to later compare measurements to each other and to be able to automate future analysis better.
Question 1: Are you aware of anybody else working with or interested in archetypes/templates for this?
Feel free to comment and improve our Inital approach intended to show data needs and explore possibilities:
-
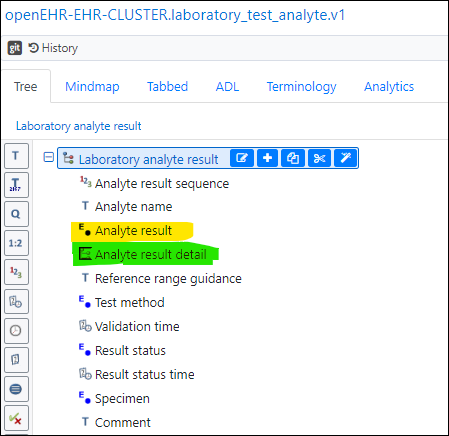
To match and extend current reporting practices in healthcare a narrative text (partly algorithmically produced and partly manually composed) will be the main result that in the “Laboratory analyte result” arcehtype goes into the “Analyte result” field (highlighted in yellow below) as text. This is what most clincians actually use/read today and it already has a code, known use etc. in the laboratory systems…
-
…and then (the new) further details (for lab-specialists, AI-algorithms and future test comparisons) would, using a new or specialised CLUSTER-archetype, fit in under “Analyte result detail” (highlighted in green above)
-
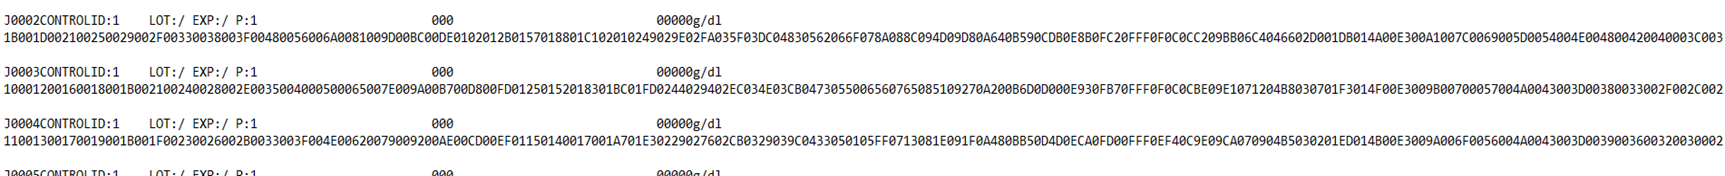
The numerical “curve” data is a kind of optical density over time “digit series” (that in is usually shown as a diagram in user interfaces). The data size is pretty small, approximately 300 data points per sample run, and can easily be stored inside the CDR (it is smaller than an image). The values can come from the instrument like a hexadecimal sequence similar to this…
…but could of course be converted to other formats before sending to a CDR. -
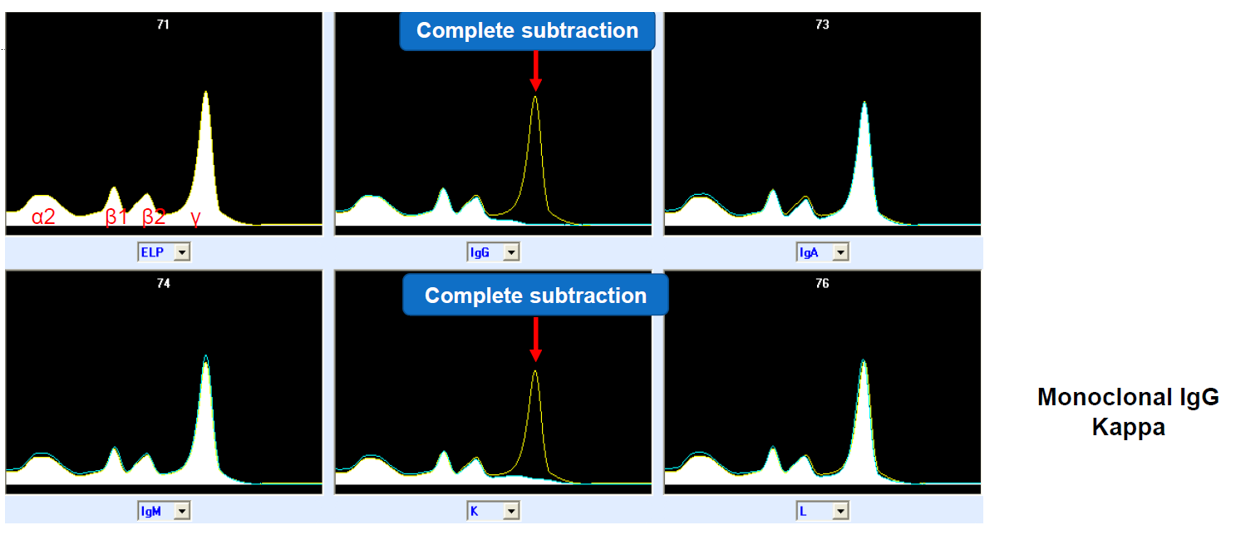
The time axis in capillary electrophoresis is a bit arbitrary and depends on many variable factors that can change between runs, so relative position and relative amplitude of peaks are the most interesting things rather than exact timing or amplitude value etc. In some cases parts of the sample undergo certain (chemical) depletion/deletion treatments and are then re-run, resulting in a family of curves; the original curve and e.g. five others with certain proteins blocked:
Question 2: What CLUSTER-archetype should we use for storing the curve(s)? Examples of alternatives:
-
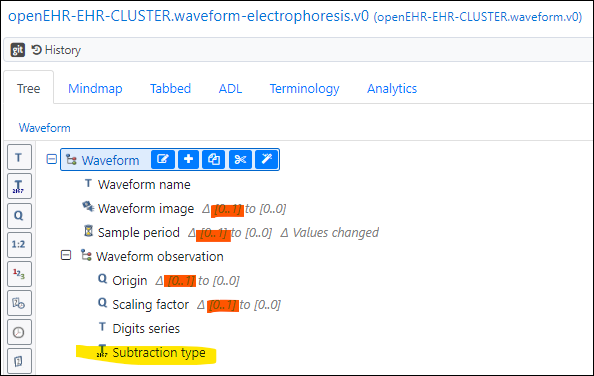
One candidate is CLUSTER.waveform.v0 but due to the somewhat arbitrary time axis etc. some of the stated “purpose” and “use” metradata of that archetype will be a bit violated in reality (but since the archetype is version 0, the descriptions could be widened). If we do the re-runs with deletion/subtraction we also need to say what protein was deleted for each curve. A specialisation of Waveform could look like below (orange highlighting marks nodes deleted by setting to 0…0 occurance, yellow marks added fields)
-
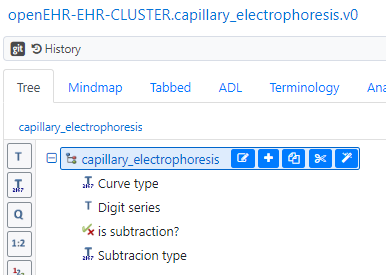
Another candidate is to make a specific little CLUSTER-archetype like the one below (possibly without the boolean if we in the archetype metadata clearly state that absence of “Subtraction type” implies that the cureve is the original curve without subtractions).
This structrue can then be repeated under “Analyte result detail” (see green highlight in first picture) for each re-run.